

Introduction:
What is Polygon Data?
The Polygon data is a set of several Latitude and Longitude and these Latitude and Longitude together create the boundary of a state. If one Latitude and longitude is available for a state then we can show Bubble map only not Region Map. The Polygon data can be downloaded from Website or purchased from ESRI. The Polygon data mainly contains five files:
- Area.cpg
- Area.dbf
- Area.prj
- Area.shp
- Area.shx
Here “Area” is the name of file, it may be different for shape files but the extension of polygon data should be ‘cpg’, ‘dbf’, ‘prj’, ‘shp’ and ‘shx’. All these files are necessary for Region Map.
Ways to make SAS Dataset for Region Map:
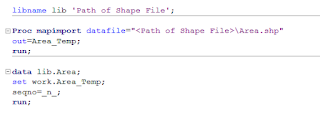
Figure 1: Code to convert shape file into SAS Dataset
SAS also made available polygon dataset. There are three library present “MAPS”, “MAPSGFK” and “MAPSSAS” in SAS EG / SAS Studio. These library contain the dataset of all the countries at State level.

Figure 2: Polygon dataset in libraries in SAS EG
Import SAS Dataset in SAS Viya VA:
Steps:
- Login the SAS Viya VA environment.
- Click on “Data” option and go to import as mentioned in below image.
- Import the polygon data as we prepared and after that click on “OK”.

Figure 3: Importing dataset in SAS Viya VA
Configure the Geography Item:
Steps:
- Click on the “+ New data item” in data pane.
- Select the Geography Item.
- Type the Name of new created geography variable and select the dataset in “Based on:” field.
- Select “Custom polygon shapes” in drop down of Geography data type option.
- Click on the “New” in Custom Polygon provider.

Figure 4: Creating New Custom Polygon Provider

Figure 5: Entering Information in Library and Table

Figure 6: Entering Information in ID Column
In Figure 6, the “ID Column” is DISTRICT but if any ID variable available in your data that represent the location, then you can also select that.

Figure 7: Select Region ID and Latitude & Longitude
